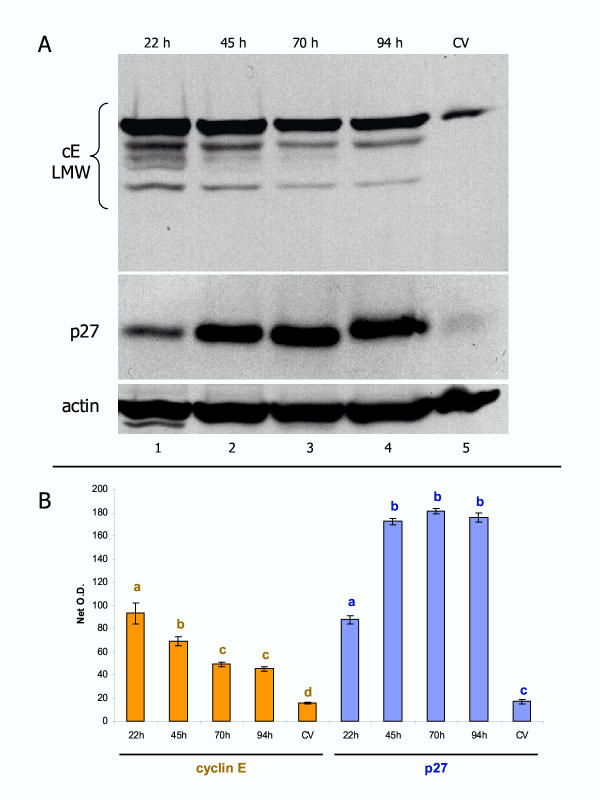
Figure 9.
Representative comparison of cyclin E and p27 protein expression in vivo and in vitro. [A] Normal placenta shows a weak expression of cyclin E low molecular weight variants (cE LMW, lane 5). Early trophoblast culture shows high cE LMW expression (lane 1) followed by gradual diminution (lanes 2–4). p27 expression is also weak in vivo, but gradually increases during trophoblast cultivation. [B] Quantitative evaluation of cE LMW and p27 blots. Each column represents mean from six net O.D. measurements ± SD. Different column superscripts (with identical color) indicate P < 0.001.

