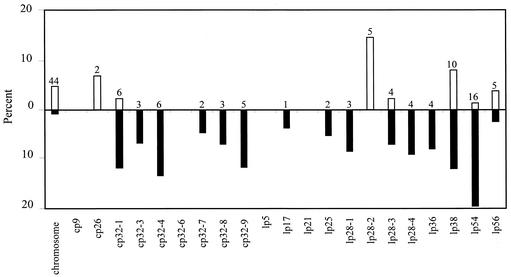
FIG. 4.
Genomic distribution of ORFs differentially expressed during DMC cultivation. The total percentage of ORFs encoded by each genetic element found to be up- or down-regulated is shown. The percent up-regulated is indicated above the line (open bars), and the percent down-regulated is displayed below the line (solid bars). The total number of ORFs differentially expressed on each genetic element is noted above each bar.

