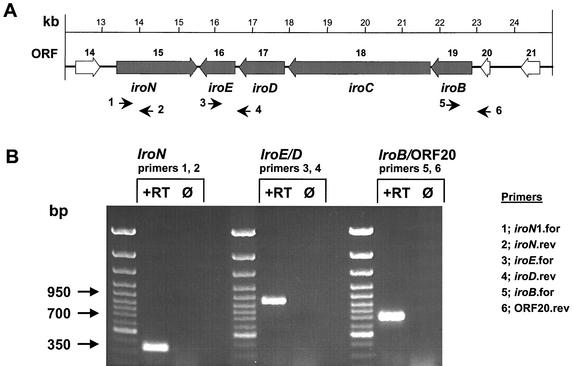
FIG. 3.
RT-PCR analysis of the iroBCDEN cluster. (A) Genetic organization of the iroN, iroBCDE, and upstream genes. Numbered arrows below the map indicate the locations of 5′ and 3′ primers used in RT-PCR. Thick arrows indicate the direction of transcription of each gene. (B) Results of RT-PCR amplification assays. Primers used in each reaction are listed above the corresponding bracket. To verify that DNA was not the amplification template, each RT-PCR was run without the addition of RT (lanes Ø). The size of the expected band for each reaction is indicated.

