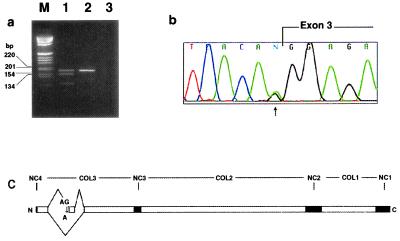
Figure 5.
(a) Reverse transcription–PCR from skeletal muscle cDNA using primers flanking the mutation. Lane M, molecular size markers in bp; lane 1, patient sample showing a normal upper band and an abnormal lower band lacking the 36-bp exon 3; lane 2, normal control containing a single upper band; lane 3, negative control without DNA. (b) Chromatogram of genomic DNA sequence from the proband. The G-to-A mutation is present in a heterozygous state at position −1 with respect to the exon ( ). (c) Schematic of the splice defect relative to the domain structure of COL9A3. COL1–3, collagenous domains 1–3; and NC1–4, noncollagenous domains 1–4.

