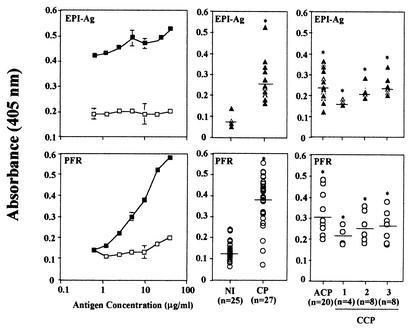
FIG. 1.
ELISA employing PFR distinguishes sera from Chagas' disease patients (CP) from sera from NI. (Left) Curves of concentrations of EPI-Ag and PFR in ELISAs employing pools of CP and NI sera. Total IgG antibodies specific to EPI-Ag (top) and PFR (bottom) in sera (1:100) of NI (□) and CP (▪) are shown. (Center) Levels of antibodies specific to EPI-Ag (▴) (top) and PFR (○) (bottom) present in individual sera from NI and CP. (Right) Levels of antibodies specific to EPI-Ag (▴) (top) and PFR (○) (bottom) present in sera from individual CP grouped according to the severity of Chagas' disease. Asterisks indicate statistical significance for comparisons between groups (P < 0,05). Each point represents the mean absorbance of duplicates.

