Figure 3.

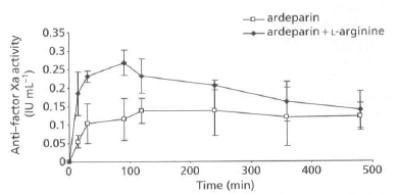
Anti-factor Xa activity-time profiles of ardeparin in rats after oral administration of formulations. Data are shown as the mean concentration, and error bars represent the s.d., n = 4–6.

Anti-factor Xa activity-time profiles of ardeparin in rats after oral administration of formulations. Data are shown as the mean concentration, and error bars represent the s.d., n = 4–6.