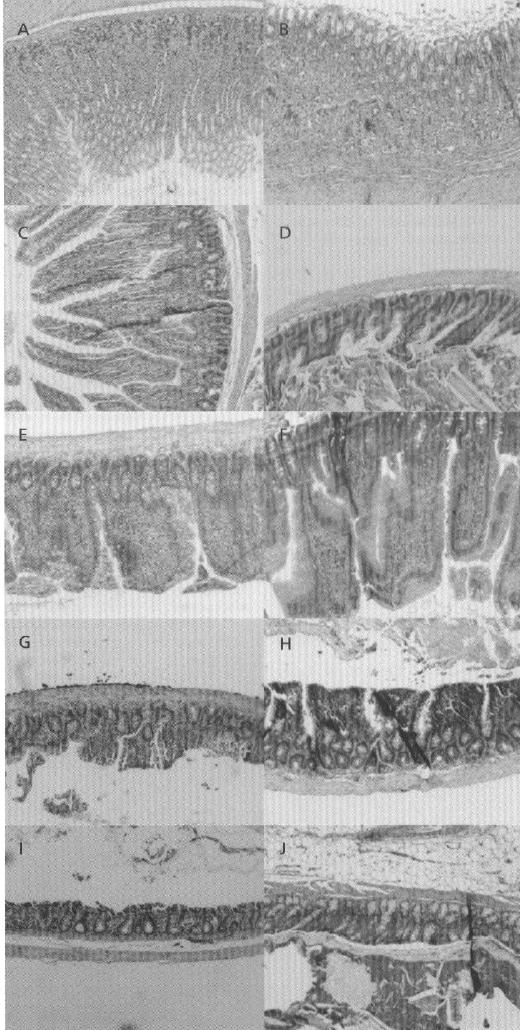
Figure 4.

H&E photomicrographs of rat gastric and intestinal tissue sections after oral administration of l-arginine (250 mg kg−1 and LMWH 1200 IU kg−1). All panels represent cross-sections of gastric and intestinal tissues. The original magnification was 100× for all panels. A, B. Stomach (control and test, respectively). C, D. Duodenum (control and test, respectively). E, F. Jejunum (control and test, respectively), G, H. Ileum (control and test, respectively). I, J. Colon (control and test, respectively).
