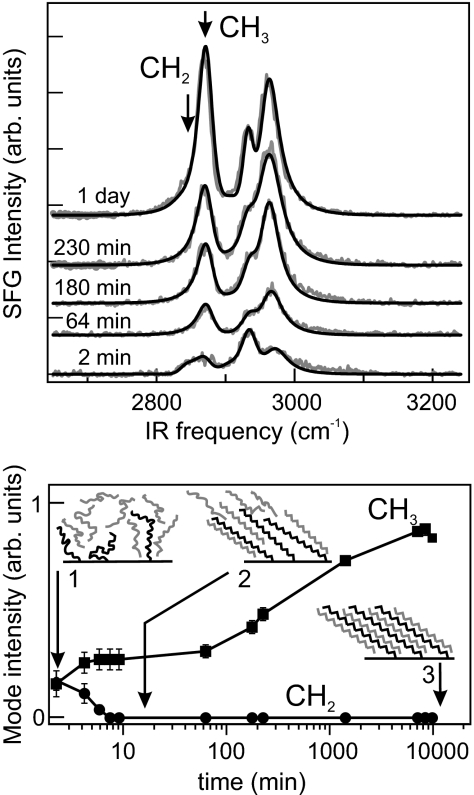
Fig. 3.
Temporal evolution of the colloidal surface after gelation. (Upper) SFG spectra (gray lines, ppp polarization) of a 24 vol% gel as a function of gel age as indicated. Fits (black lines) were performed as described in ref. 28. (Lower) Amplitude of the symmetric CH3 (squares) and CH2 (circles) stretch modes at the frequencies indicated by the arrows in Upper. The structure of the boundary layer is schematically depicted for the three most relevant time intervals during gel formation and aging.

