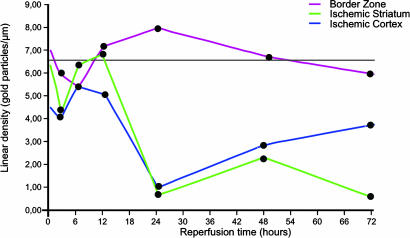
Fig. 3.
Time course of AQP4 expression after MCAO. Values along the ordinate represent linear density of gold particles over perivascular membranes (same samples as in Fig. 2). Density values were obtained from the central part of the ischemic cortex (blue), striatal part of the core (green), and cortical border zone (red). The horizontal black line indicates the reference level (calculated from the neocortex and striatum contralateral to the lesion). The values for the ischemic cortex (blue) and striatal core (green) are significantly different from the reference values for reperfusion times of 24, 48, and 72 hr. The corresponding P values are 0.0058, 0.0122, and 0.0477 (cortex) and 0.0043, 0.0076, and 0.0052 (striatum), respectively.

