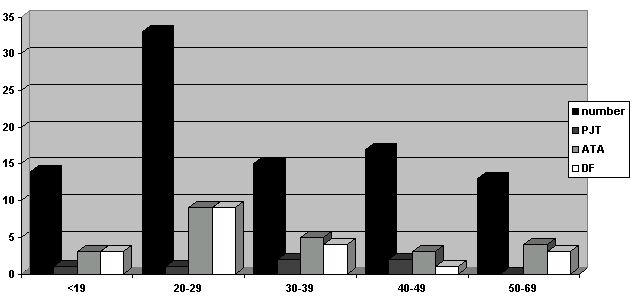
Figure 3.

representation of the data of entire population according to the age :
- in black : total number of patients
- in dark grey : number of induced reciprocating tachycardia
- in light grey : number of induced atrial tachyarrhythmia
- in white : number of dangerous form of WPW syndrome
