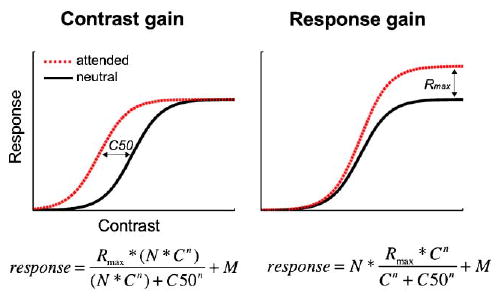
Fig. 1.

Possible effects of attention on the contrast response function. The left panel depicts a contrast gain model for attention. Contrast gain predicts an increase in sensitivity that is a function of stimulus intensity, and is characterized by a leftward threshold (C50) shift in the contrast response function. The dashed curve represents the signature curve shift brought about by attentional contrast gain; the shape of the function does not change, but rather shifts leftward—boosting the effective contrast of the stimulus. In the right panel, the dashed curve (attended) represents the effects of attention according to response gain models. Response gain predicts an increase in firing rate, which is characterized by a change in the shape of the curve—in slope and asymptote (Rmax). C50, threshold; Rmax, asymptote; n, slope; C, contrast level; N, attentional modulation; and M, response at lowest stimulus intensity.
