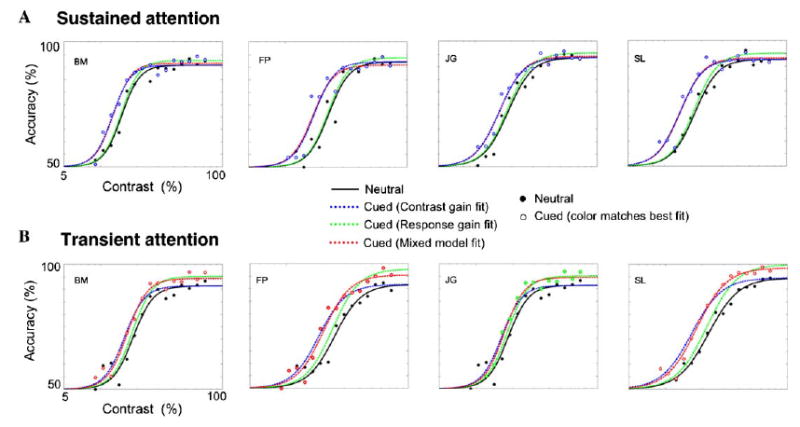
Fig. 5.

Contrast gain, response gain and mixed model fits to the data for sustained (A) and transient (B) covert attention. Filled circles correspond to the neutral data, and the hollow circles represent the precued data. The color of the hollow circles corresponds to the fit that best describes the attentional data. The solid black line is the fit to the neutral condition, the dashed green line corresponds to the attentional response gain model fit Eq. (2), the dashed blue line is the fit to the attentional contrast gain model Eq. (3), and the dashed red line corresponds to the mixed model Eq. (4).
