Fig. 3.
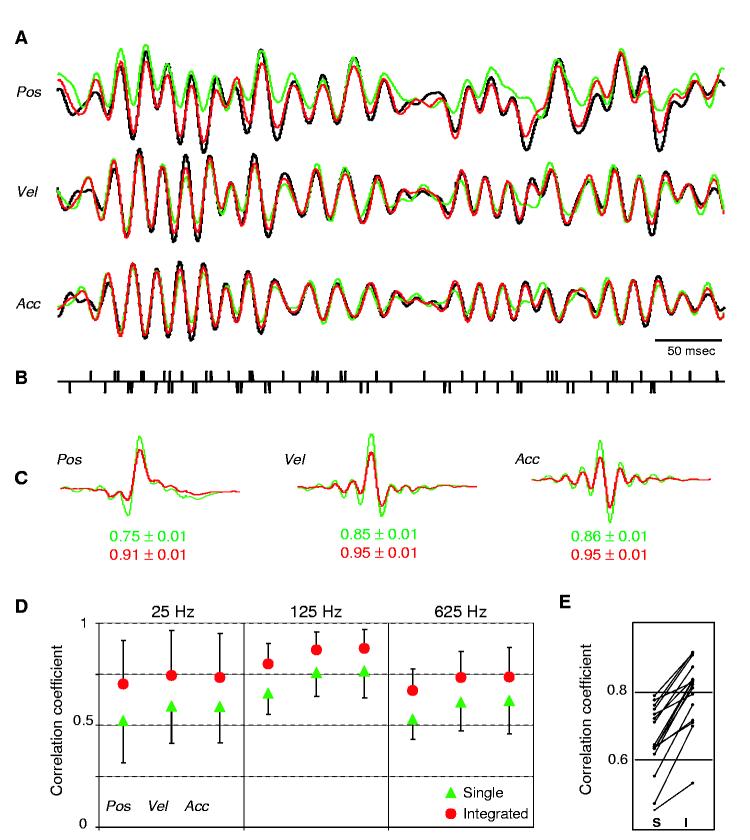
Prediction values significantly improve when integrating spikes elicited in response to stimulation in opposite directions. (A) Original 125-Hz stimulus (black), single predictions (green), and integrated predictions (red). (B) Integrated spike train used to compute the predictions in (A). Spikes in response to the original stimulus were assigned the value of +1; those in response to the reversed stimulus were assigned the value of -1. (C) Kernels used to compute the predictions in (A) and corresponding correlation coefficients: single (green) and integrated (red). (D) Group data (mean ± SD) for all neurons (n = 16). Prediction values increase for all stimulus parameters at all frequencies tested. (E) Integration significantly increases predictions for every neuron. Prediction values (125-Hz position) computed for single (S) and integrated (I) spike trains.

