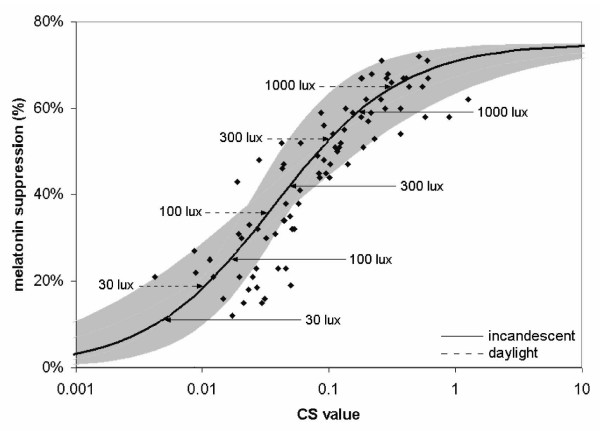
Figure 3.
Melatonin suppression [35, 41-45] as a function of circadian stimulus (CS) [37]. Horizontal arrows show the corresponding CS value for varying corneal illuminances from incandescent (solid arrows) and daylight (dashed arrows) illumination [46]for one hour exposures. The shaded band represents the modeled best fit (solid black line, r2 = 0.82) using a four-parameter logistic equation [47] and the standard errors of the best-fitting coefficients to the model.

