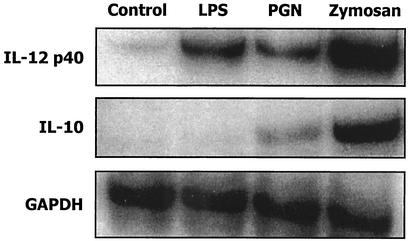
FIG. 2.
IL-10 and IL-12p40 mRNA levels in LPS-, PGN-, and zymosan-stimulated DCs. DCs were stimulated for 12 h with 1 μg of LPS, 10 μg of PGN, or 5 μg of zymosan/ml, and then total RNA was isolated and subjected to RNase protection assay with the RiboQuant multiprobe template set mCK2b. The bands corresponding to IL-12p40, IL-10, and GAPDH (glyceraldehyde-3-phosphate dehydrogenase) are shown. The data represent two independent experiments.

