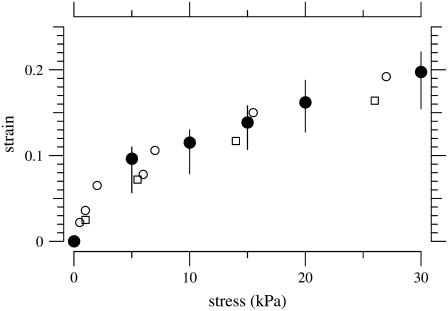
FIGURE 3.
Equilibrium stress-strain relation of a PMAA gel. The solid circles represent the median value of the strain for a given stress applied using PEG solutions to exert osmotic pressure. The vertical lines shows the interquartile ranges. The solutions contained 174 mM KCl. The open symbols represent the stress-strain relation measured using hydraulic pressure with a dynastat in different KCl concentrations; open circles and open squares represent KCl concentration of 100 mM and 200 mM, respectively (30).

