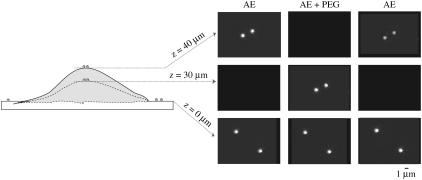
FIGURE 5.
The right side shows fluorescent images of two beads on the TM and two on the glass slide. The columns correspond to different bathing solutions. Each row shows images in a different focal plane. The left side shows a schematic diagram of the profile of the TM and glass slide. In AE, the beads are in focus at a height of 40 μm. When PEG is added to the AE solution, the TM shrinks and hence the two beads on the surface of the TM are in focus at 30 μm. The beads on the surface of the glass slide remain in focus at the same height in both solutions.

