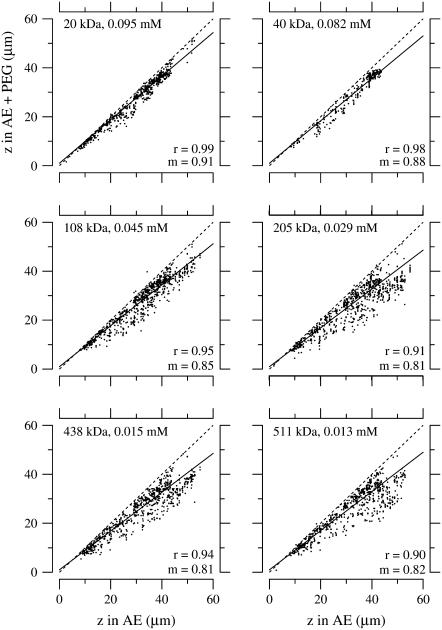
FIGURE 6.
Effect of isosmotic solutions with different PEG molecular mass on TM thickness. Thickness (z) of TMs from the apical-middle regions in PEG solutions versus that in the absence of PEG. Each solution contained AE. Different concentrations of PEG were added to each solution so that the osmotic pressure exerted by that particular molecular-weight PEG was equal to 250 Pa according to Eqs. 7–9. Each dot represents one bead on one of three TMs. The solid and dashed lines represent a regression line fit to the data and a line of unity slope, respectively. The values of the slope and correlation coefficient of the regression lines are given by m and r, respectively.

