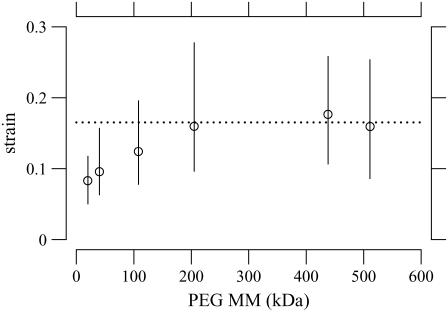
FIGURE 7.
TM strain as a function of PEG molecular mass for an applied osmotic pressure of 250 Pa. This plot summarizes data from the same experiments as in Fig. 6. The circles represents the median strain. The lengths of the solid vertical lines indicate the interquartile ranges of the measurements. The horizontal line is at a strain of 0.16, which is the average value for MM ≥ 200 kDa.

