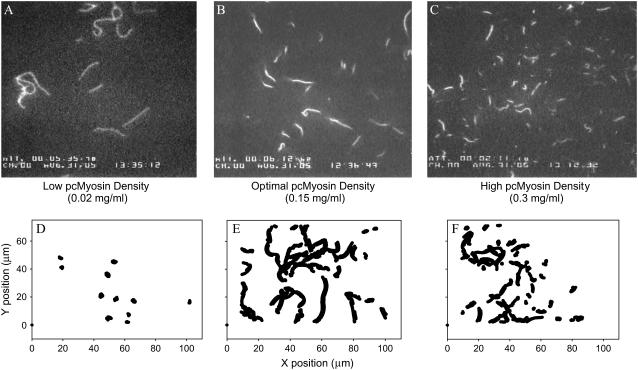
FIGURE 8.
Representative data from motility assays at different surface densities of pcMyosin. Single video frames (A–C) and centroid analysis (D–F) were from assays conducted after applying (A, D) 0.02 mg/ml pcMyosin, (B, E) 0.15 mg/ml pcMyosin, or (C, F) 0.3 mg/ml pcMyosin. Panels D–F represent the superposition of centroids of all actin filaments over a 30-s time period that includes the frames shown in panels A–C. Little progressive motility is indicated at low (D) and high (F) densities by very small changes in centroid position over time. Progressive motility is indicated at optimal density (E) by continuous lines (superimposed time series). Very short filaments are evidence for shearing of actin filaments at high pcMyosin densities (C).

