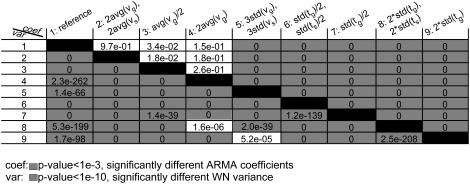
FIGURE 6.
ARMA descriptors distinguish between dynamics simulated with different model parameters. The discrimination matrix shows p-values for the comparison of ARMA coefficients (above diagonal) and WN variance (below diagonal). Coefficient comparison p-values <10−3 and variance comparison p-values <10−10 (highlighted in gray) indicate statistically significant differences. p-Values of 0 indicate p-values <10−324.

