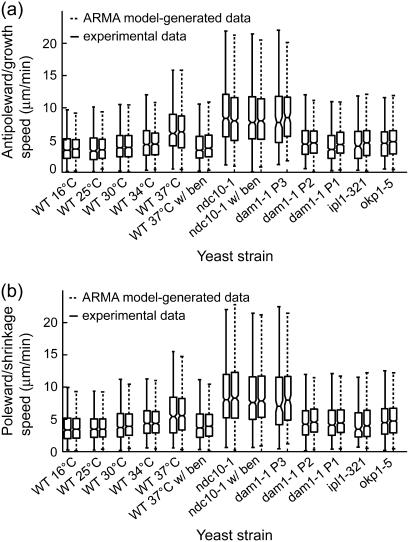
FIGURE 8.
ARMA descriptors implicitly contain the dynamic information captured by growth and shrinkage speeds. Box and whisker plots of (a) growth and (b) shrinkage speed distributions from experimental data and corresponding ARMA-generated trajectories (see text for details) show that the experimental and ARMA-generated distributions are equivalent. Box lines indicate the 25th percentile, median, and 75th percentile of a distribution, whereas whiskers show its extent. Boxes whose notches do not overlap represent distributions whose medians differ at the 5% significance level.

