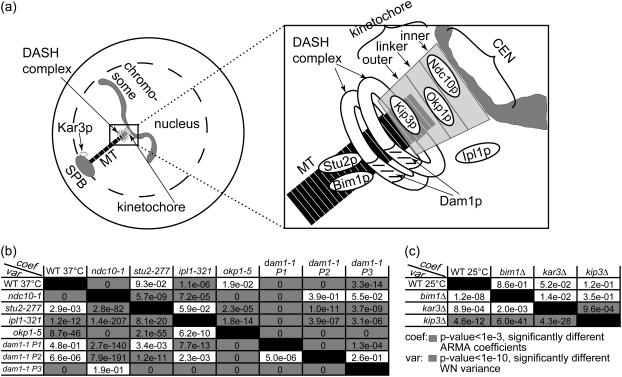
FIGURE 9.
ARMA descriptors detect differences between kMT dynamics in mutants of kinetochore and other MT-binding proteins in G1. (a) Schematic of an S. cerevisiae G1 cell (for graphical simplicity, only one chromosome is depicted) with a zoom-in on the region of kMT-chromosome attachment, showing the approximate locations of the investigated proteins. (b) Discrimination matrix showing p-values for the comparison of kMT dynamics in WT at 37°C and various temperature-sensitive mutants at their nonpermissive temperature of 37°C. (c) Discrimination matrix showing p-values for the comparison of kMT dynamics in WT and strains carrying deletions of nonessential proteins at 25°C. Coefficient comparison p-values <10−3 and variance comparison p-values <10−10 (highlighted in gray) indicate statistically significant differences. p-Values of 0 indicate p-values <10−324.

