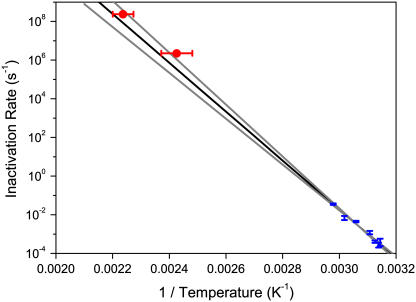
FIGURE 3.
Arrhenius plot of the rate of loss of enzymatic activity of catalase immobilized at a gold surface (see Fig. 1 a). The data points in the lower right are obtained by heating in a water bath (error bars represent mean ± SE fits to inactivation rate), whereas the upper left data points used the laser heating apparatus 1 (error bars are 95% confidence interval). The line of best fit (bold) and 95% confidence interval lines were determined by fitting the water bath data only.

