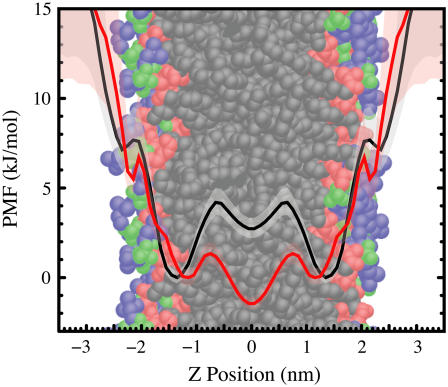
FIGURE 3.
The PMF for the depth of the indole nitrogen atom relative to the POPC bilayer center from a simulation using charge set 1 (black curve) and the PMF for the depth of the center of mass of Benzene relative to the POPC bilayer center using charge set 1 (red curve). This figure shows that indole localizes in the interfacial region, but benzene does not localize. The PMFs are vertically offset for clarity. These PMF plots do not provide absolute free energy values anyway—all values are strictly relative. The diffuse background indicates an estimated 95% confidence interval. The PMFs are superimposed on a snapshot of the bilayer colored to show various chemical groups (choline/blue; phosphate/green; glycerol/red; hydrocarbon core/black).

