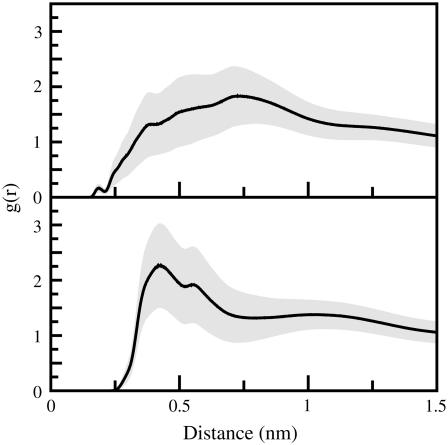
FIGURE 9.
The distribution of phosphate atoms (upper panel) and choline heavy atoms (lower panel) relative to the center of mass of the indole molecules (averaged over all indole molecules in the simulation). Curves are normalized so that the density curves approach the bulk density of phosphate and choline groups within the unit cell.

