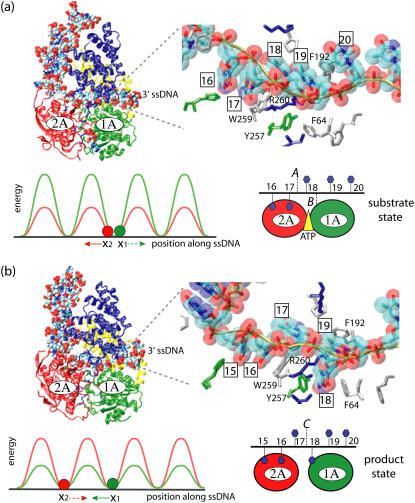
FIGURE 1.
Schematic view of a PcrA helicase-DNA complex with ATP bound (a) and without ATP/ADP bound (b). (Top, left) Shown are the protein domains (in cartoon presentation: red, 2A domain; green, 1A domain; blue, 2B domain; yellow, 1B domain) along with DNA (van der Waals presentation: red, oxygen; cyan, carbon; blue, nitrogen; tan, phosphorus; white, hydrogen); the duplex DNA is bound to the top left of PcrA and is flanked by a 3′ ssDNA that crosses through the middle of PcrA from left to right. (Top, right) Shown is an enlarged view of the ssDNA crossing through PcrA together with key amino acids. The DNA is shown in both licorice and (transparent) van der Waals (hydrogens not shown for clarity) presentation; amino acids (in licorice presentation) are color-coded (green, polar; white, nonpolar; blue, positively charged; red, negatively charged). Note that the DNA strand is negatively charged. (Bottom, right) The top figures are summarized into a schematic view highlighting the key elements, including the numbering of the ssDNA units (nucleotides) directly involved in binding. (bottom, left) The individual potentials of the two PcrA domains moving along ssDNA are introduced; the red and green disks correspond to the position of the domains 2A and 1A, respectively; the corresponding potential energy profiles are given in red and green; one can recognize that in the (substrate) state (a) with ATP bound, domain 2A is supposed to experience lower energy barriers than domain 1A, while in the (product) state (b) after ADP and phosphate dissociate, domain 1A is supposed to experience lower energy barriers than domain 2A. We use in this figure and other figures the one-letter code for amino acids.

