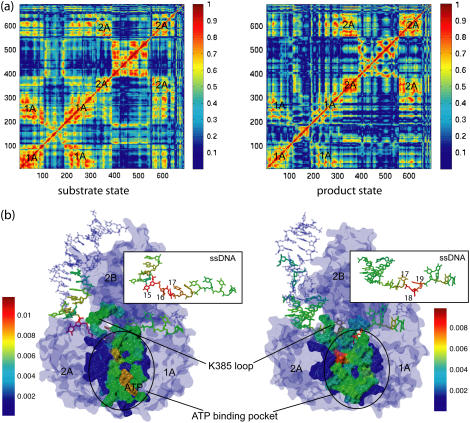
FIGURE 8.
Correlation analysis based on MD simulations (a) and a so-called dynamical coupling analysis based on an elastic network model (61) (b). The correlation maps in panel a are colored according to the amplitude of the cross correlation matrix element C(i, j) defined in the text. The matrices were calculated from 3-ns MD simulations for both the s and p states. In the s state, the average amplitude of cross correlation is ∼0.71 inside domain 1A and ∼0.68 inside domain 2A; in the p state, the average amplitude of cross correlation is ∼0.58 inside domain 1A and ∼0.63 inside domain 2A. The PcrA-DNA complexes in panel b are colored according to the dynamical coupling of residues to the fluctuations of the ATP binding pocket in both the s and p states. The dynamic coupling is probed (see (61)) through perturbation of a residue's spring constant and monitoring the ensuing effect on the vibrational fluctuation 〈δr2〉 of the ATP binding site. The protein, DNA, and ATP are shown in surface, licorice, and vdW presentations, respectively.

