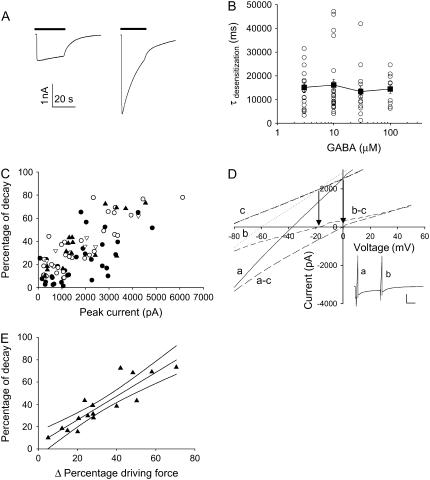
FIGURE 3.
Current decay during GABA application correlates with the current magnitude. (A) Two examples of current evoked by 30 μM GABA (bar) with extreme differences in the apparent desensitization. Both cells were voltage clamped at −60 mV and had comparable cell capacitance and access resistance. (B) A scatter diagram of the apparent desensitization (τdesensitization) for different GABA concentrations. Open circles are individual cells, and the solid square is the mean ± SE. (C) A scatter plot of percentage of current decay during GABA application versus peak amplitude for 100 μM (Δ), 30 μM (▴), 10 μM (○), and 3 μM (•). (D) A ramp command voltage (−80 to +50 mV) was issued at different times (a near peak and b after decline) during a response to 30 μM GABA application (inset), and the resulting I-V curve calculated as the difference between the passive I-V obtained before GABA application (heavy dashed c) and the active I-V curves (dot b and line a), demonstrated a shift of ECl from 0 mV to −20 mV. For this particular cell, the passive I-V curve demonstrated a linear input resistance of ∼32 MΩ. Arrows denote the apparent reversal potential defined as the intersection between the passive and active I-V curves. (E) A scatter plot of 16 cells examined at 30 μM GABA with the best fitting linear correlation with 95% confidence interval (r2 = 0.79) between the percentage of current decay and percentage change in driving force as determined by the ramp I-V experiments.

