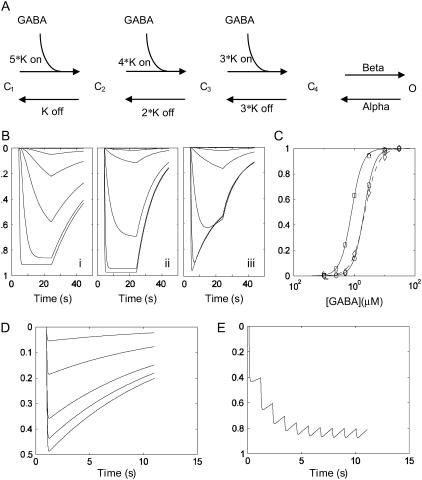
FIGURE 4.
A kinetic model of ρ1 GABAC channels and simulations based on the optimized rate constants. (A) A five-state model of ρ1 channel previously used to explain the kinetic behavior of the same subunit expressed in Xenopus oocytes (4). The model consists of three identical GABA binding sites and a single transition of the fully bound receptor (C4) to an open state (O). (B) A plot of simulated probability of opening versus time for the oocyte parameter set (i), optimized HEK cell parameter set (ii), and as in ii but incorporating an ECl shift into the model (see Table 1). (C) Simulated concentration-response curves based on the peak conductance attained during the GABA application without (circle) or with (diamond) the ECl shift. Note the slight underestimation of the peak current magnitude at high [GABA] caused by the loss of driving force and a slight rightward shift of the estimated concentration–response curve (dashed line). The oocyte parameter set results in a leftward shifted concentration–response curve (square). (D) Simulated responses to 1 mM GABA pulses of different durations (1, 2, 5, 10, 20 ms). (E) A response to a slow train (1 Hz) of 1 mM GABA pulses. Note the saturation of the conductance because of the slow deactivation kinetics even at this very slow rate of action potential train. The vertical axis represents the probability of channel opening p(o) except for the simulation incorporating the ECl shift (Biii), which represents the normalized macroscopic current I(t)/N*γ = p(o)*(Vm − ECl), where N = channel number, γ = single-channel conductance, p(o) = probability of channel opening, Vm = membrane potential, and ECl = Cl− Nernst potential.

