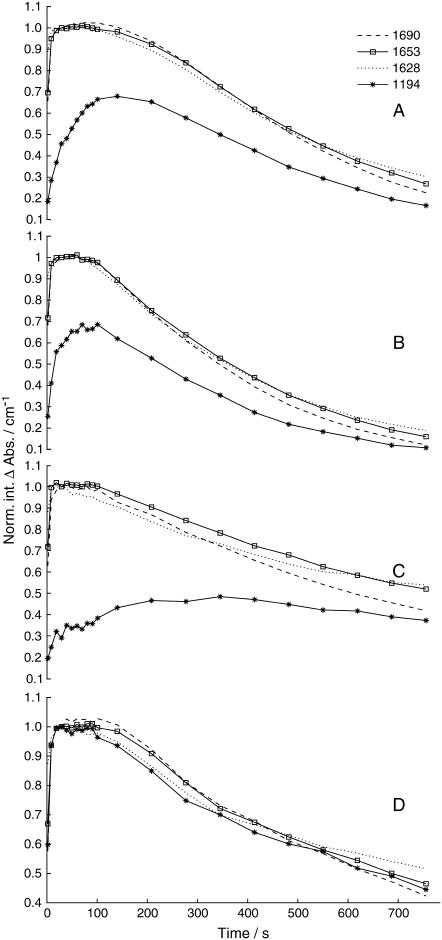
FIGURE 5.
Time-course of selected infrared bands observed in isotope exchange experiments with ADK and control experiments. Labels refer to the wavenumber in cm−1 of the bands. The amplitudes were normalized as described in Materials and Methods. (A) Isotope exchange experiment with 0.5 mg/ml ADK using caged [γ-18O3]ATP. (B) Isotope exchange experiment with 1 mg/ml ADK using caged [γ-18O3]ATP. (C) Control experiment without ADK using caged [γ-18O3]ATP. (D) Control experiment with unlabeled ATP with 0.5 mg/ml ADK.

