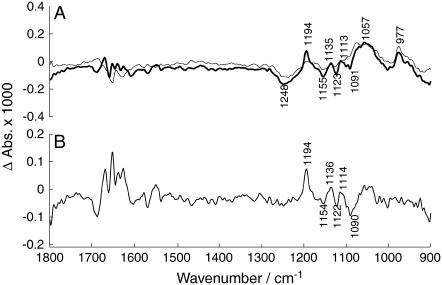
FIGURE 8.
Spectrum of ADK-mediated isotope exchange with 1 mg/ml ADK. (A) (Bold spectrum) Absorbance change between 3.4–24 s and 24–75 s; the flash artifact band at 1282 cm−1 was subtracted. (Thin-line spectrum) Absorbance change between 75–96 s and 24–75 s. Labels refer to the bold spectrum. (B) Subtraction of the two spectra shown in panel A.

