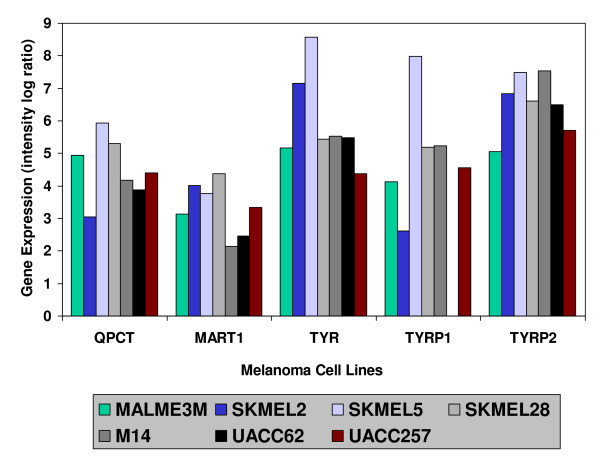
Figure 2.
Highly expressed genes within the Ross et al Melanoma Component. Gene expression levels of 5 genes within each of the 7 cell lines in the Ross et al cDNA Melanoma Component. Measurements were log ratios between the gene expression level of each cell line and a reference sample of 12 of the 60 tumor cell lines. Further details may be found in the original Ross et al publication. The means for each gene for the non-melanoma cell lines (followed by the Student t test significances for the mean difference between melanoma and non-melanoma cell lines) were as follows: QPCT -.514 (p < .001), MART1 -.055 (p = .001), TYR -.031 (P < .001), TYRP1 -.449 (P < .001), and TYRP2 -.041 (p < .001). It may be seen that the means of the non-melanoma cell lines were all very close to zero, and therefore were not plotted simply for greater clarity of presentation.

