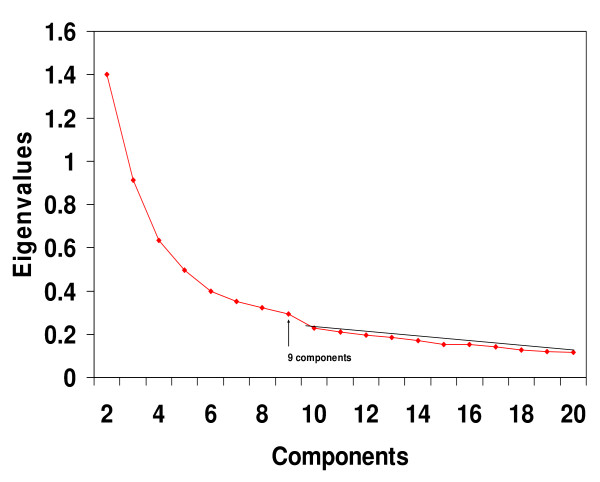
Figure 3.
Scree test for the Staunton et al dataset. Eigenvalues from the 60 × 60 cell line correlation matrix showed that, beginning with the break in the plot after component 9, a straight scree line could be fitted to the remaining values. Such a finding suggests that the eigenvalues after component 9 represent only error variance. Note that for clarity of presentation, the first eigenvalue of 51.392 was not plotted.

