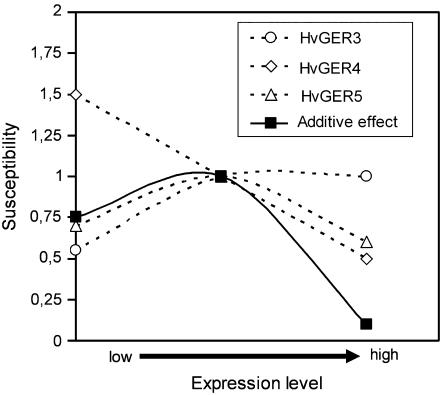
Figure 7.
Model of fine regulation of basal resistance by HvGER protein expression in barley. The model is based on TIGS (x axis low) and overexpression (x axis high) data of this study. The y axis shows the relative susceptibility compared to the empty-vector controls (set to 1), which are assumed to correspond to median expression levels. For calculation of the hypothetical additive effect of all three HvGER proteins, the differences between relative susceptibility values and control value 1 were added to value 1. Please note that all three HvGER subfamilies in the model are predominantly expressed in leaf epidermis (Fig. 4).

