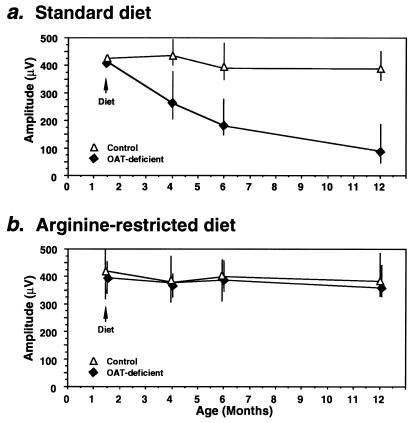
Figure 4.
ERG amplitudes of Oat−/− and control mice on either a standard (a) or an arginine-restricted (b) diet over 12 months of life. Oat−/− and control mice were divided into groups of 5–8 animals. In a, a group of control and a group of Oat−/− mice were placed on standard diet for 12 months whereas in b, groups of control and Oat−/− mice were placed on an arginine-restricted diet at age 6 weeks. The symbols represent the mean, and the vertical bars the range, of ERG amplitudes recorded from control mice (open triangles) or Oat−/− mice (filled triangles) at indicated ages. The ERG amplitude was calculated as the difference between the peak of the A wave and the peak of the B wave (33).

