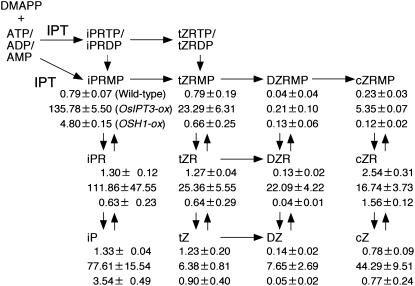
Figure 4.
CK concentrations in wild-type and transgenic rice. Endogenous levels (pmol g−1 fresh weight) in wild-type (top value in each group), OsIPT3 overexpresser (middle), and OSH1 overexpresser (bottom) are shown below each product. Measurements were performed in triplicate and the mean values with sd are shown.

