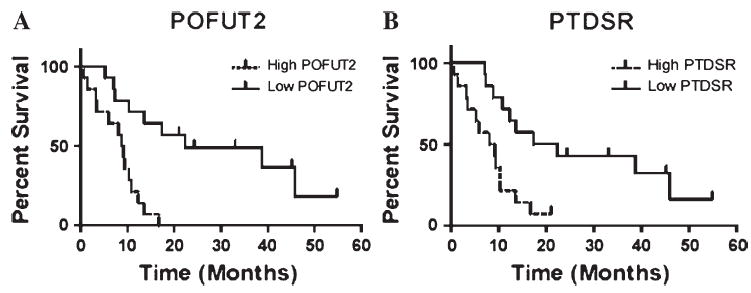
FIGURE 3.

Glioblastoma patient survival based on prognostic markers. Survival curves are drawn with patient survival dichotomized by median expression values for illustration. Cox regression p values are given. (A)POFUT2 (protein-o-fuco-syltransferase 2; p = 0.0005; multiple testing maxT p value = 0.0597); (B)PTDSR (phosphatidylserine factor; p = 0.0021; multiple testing maxT p value = 0.2003).
