
Figure 2.
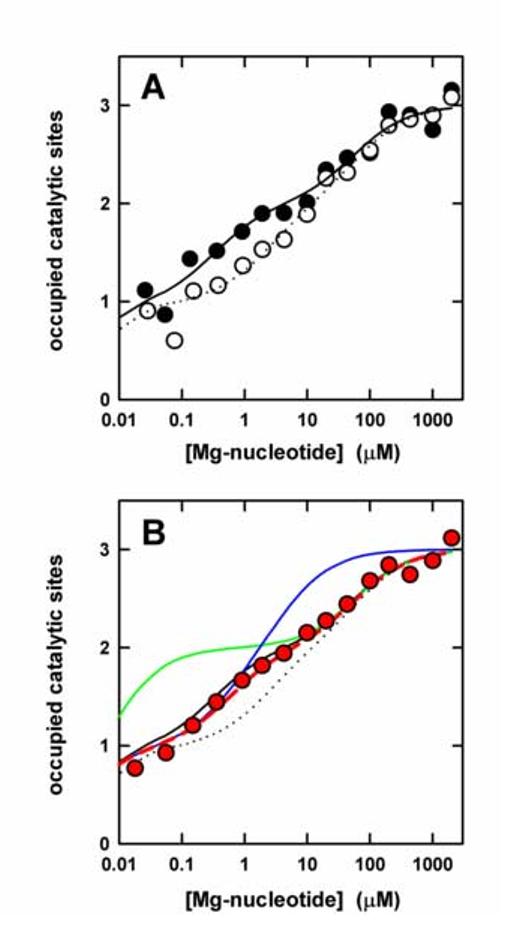
Binding of MgATP and MgADP to the catalytic sites of F1-ATPase in presence of azide. (A) Binding of MgATP (filled circles) and MgADP (open circles). Buffer contained 50 mM Tris/H2SO4, 10 mM azide, 2.5 mM MgSO4, pH 8.0. Each data point represents the average of three independent measurements. The lines represent the theoretical binding curves giving the best fit to the data points; MgATP, solid line; MgADP, dotted line. Kd values are given in the text. (B) The red symbols represent the experimental data points for a 1:1 MgATP:MgADP mix. The colored lines are theoretical binding curves for such a mix under the different binding scenarions described in the text to Fig. 1 B. The binding curves for MgATP and MgADP from (A) are shown in black.