
Figure 3.
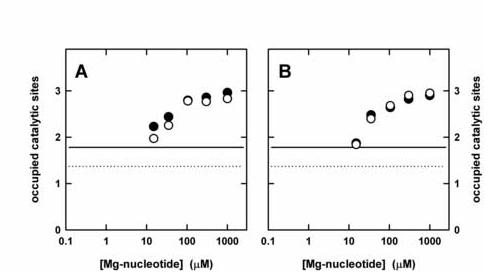
Binding of MgATP (A) or MgAMPPNP (B) to the catalytic sites of F1 after preincubation with MgADP (open circles) or MgADP-fluoroaluminate (filled circles). Buffer was 50 mM Tris/H2SO4, 2.5 mM MgSO4, pH 8.0. The horizontal lines indicate the number of occupied sites after preincubation with 5 μM MgADP (dotted line) or 5 μM MgADP-fluoroaluminate (solid line), before addition of MgATP or MgAMPPNP. The x-axis scale represents the total Mg-nucleotide concentration, i.e. MgADP (± fluoroaluminate) and MgATP (A) or MgADP (± fluoroaluminate) and MgAMPPNP (B).