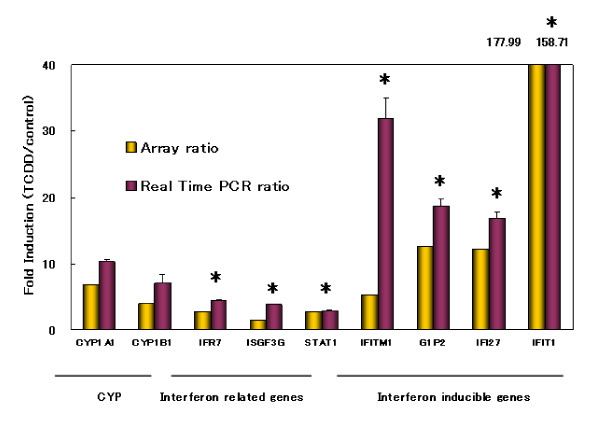
Figure 1.
Induction of CYP1A1, CYP1B1 and interferon related genes in human AEC by TCDD. Expression levels were determined by DNA microarray and quantitative real-time PCR analyses as described in Methods. Values were expressed as fold induction (TCDD/control). The representative microarray data are shown as yellow columns. The values obtained by PCR analyses are shown as red columns. The data are shown as mean ± SD of three independent experiments. *, P < 0.05 compared with the value of CYP1A1.

