
Figure 3.
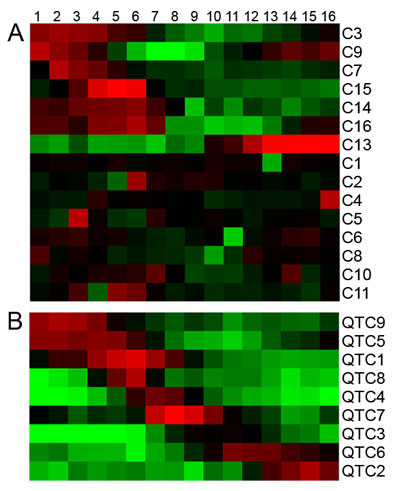
ICA and QTC analyses of the serum induced expression response. A) A heat map of the A values for the corresponding ICA components. Components C3, C9, C7, C15, C14, C16, and C13 organized according to temporal appearance. B) A heat map of the median expression values for the corresponding QTC clusters. QTC clusters organized according to temporal appearance.