
Figure 4.
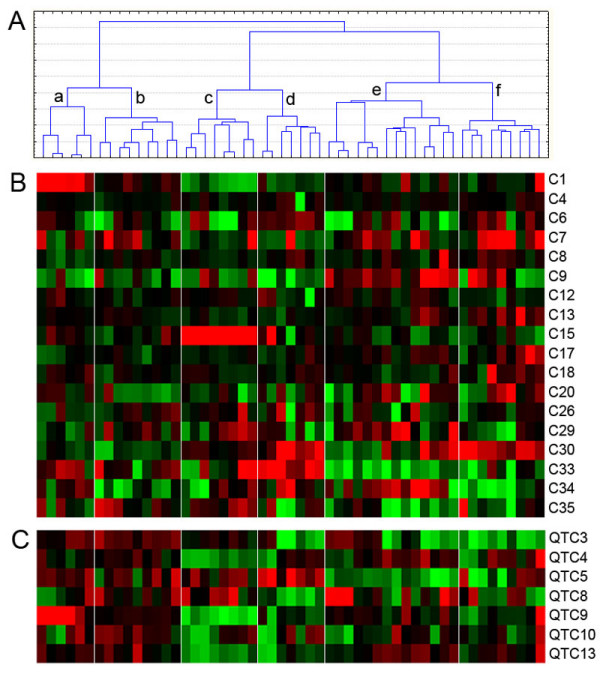
Hierarchical cluster analyses of the HNSCC data set. A) Hierarchical cluster analysis of HNSCC cases using genes assigned to at least one component. Cluster names (a-f) as indicated. B) The aligned heat map of A values for the corresponding components. C) The aligned heat map of the median expression values for the corresponding QTC clusters.