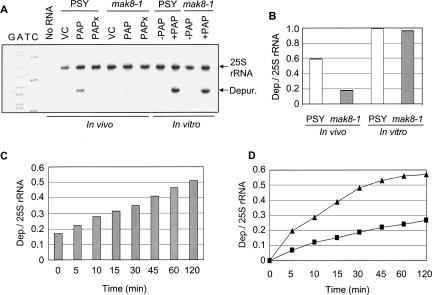
FIGURE 2.
Depurination of 25S rRNA in PSY and mak8-1 cells in vivo and in vitro. (A) For in vivo analysis, PSY and mak8-1 cells were induced to transcribe wtPAP and PAPx in SD-Leu 2% galactose medium for 4 h. Total yeast RNA was purified from induced cells and subjected to primer extension. For in vitro analysis, ribosomes (30 μg) from uninduced mak8-1 and PSY cells were incubated with purified PAP (30 ng) for 30 min at 30°C. Ribosomal RNA was extracted and subjected to primer extension analysis. Vector controls (VC) were cells that had been transformed with an empty vector. 25S rRNA is a control for total RNA in each sample and “Depur.” indicates the degree of depurination of the sarcin/ricin loop. Deoxynucleotide sequencing of the 25S rDNA with the depurination primer indicates the site of the missing purine. The gel is a representative of four independent experiments. (B) Densitometric analysis was performed on the level of depurination in each sample by taking the ratio of depurination to 25S rRNA band densities. (C) Depurination of 25S rRNA of mak8-1 cells immediately following lysis versus incubation after cell lysis. mak8-1 cells were induced to transcribe wtPAP for 4 h in SD-Leu 2% galactose medium. Total RNA was extracted from the lysate of cells immediately after induction (time zero) and from lysate incubated at 30°C for the times indicated after lysis. RNA collected from each sample was analyzed by primer extension. Densitometric analysis was performed by taking the ratio of depurination to 25S rRNA band densities. (D) Time course of ribosome depurination in lysates of PSY and mak8-1 cells. Total cellular lysate (400 μg) was incubated with PAP (20 ng) and aliquots were removed at the indicated time points. Following incubation, total RNA was extracted and the level of rRNA depurination was determined by primer extension analysis. Densitometric analysis was performed on each sample by taking the ratio of depurination to 25S rRNA band densities. Triangles indicate the level of depurination in PSY lysate and squares indicate the level of depurination in mak8-1 lysate.

