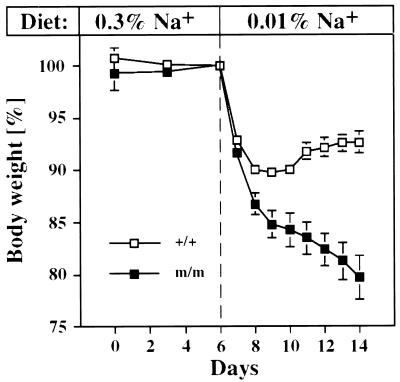
Figure 5.
Body-weight measurements in βENaC +/+ (n = 12; open squares) and m/m (n = 8; closed squares) mice. Animals were kept 6 days (days 0–6) on normal-salt diets (3 g/kg Na+), which then were replaced by low-salt diets (0.1 g/kg Na+) for 8 more days (days 6–14). Body weights of each group are indicated as percentage of reference weight (100% at day 6). Mice were weighed daily at the same time.

