Figure 6.
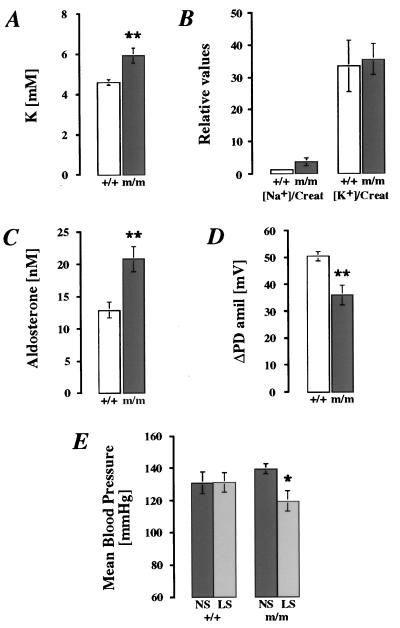
Physiologic measurements in adult βENaC m/m (black bars) and +/+ (white bars) mice on low-salt diets (0.1 g/kg Na+; A–D). (A) Plasma K+. For each group, n = 7. ∗∗, P < 0.01. (B) Relative values of urinary Na+ and K+ normalized with creatinine (Creat). For βENaC +/+, n = 7; for βENaC m/m, n = 6. (C) Plasma aldosterone levels (nM). For each group, n = 6. ∗∗, P < 0.01. (D) In vivo measurements of ΔPDamil. For βENaC +/+, n = 6; for βENaC m/m, n = 7. ∗∗, P < 0.01. (E) Mean blood-pressure measurements in βENaC +/+ (n = 7) and m/m (n = 8) mice on normal-salt diets (NS; 3 g/kg Na+) and low-salt diets (LS; 0.1 g/kg Na+). ∗, P < 0.05.

