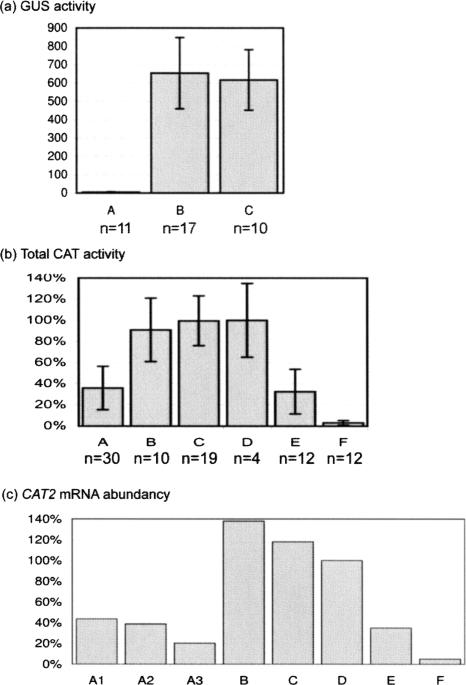
FIGURE 2.
Protein and RNA levels in F1 hybrid plants. (a) GUS activity levels in protein extracts of leaf tissue harvested from transgenic Arabidopsis plants containing different combinations of loci X21, Y7 and Zc. SD is given by error bars. A, X21-/Y7-/ZcZc; B, --/Y7*/ZcZc; C, X21X21/--/ZcZc; n, total number of plants tested; TSP, total soluble protein. (b) Average total CAT activity in wild-type and transgenic Arabidopsis plants containing different combinations of loci X21 and Y11 or containing a CAT2 hairpin construct (Vandenabeele et al. 2004). CAT activity in protein extracts of leaf tissue was measured with a spectrophotometric assay. The average total CAT activity of the different transgenic plants is relative to the average CAT activity of four wild-type (Col-0, D) plants, which is set at 100%. SD is given by error bars. A, X21-/Y11-/CATCAT; B, X21X21/--/CATCAT; C, --/Y11Y11/CATCAT; D, Col-0; E, CAT2HP1; F, CAT2HP2; n, total number of plants tested. (c) CAT2 mRNA abundancy. A quantitative real-time PCR was performed using CAT2-specific primers to determine the CAT2 RNA level relative to that in a wild-type background (100%). A1, A2, and A3, RNA levels in three X21-/Y11-/CATCAT plants; B, RNA level in one X21X21/--/CATCAT plant; C, RNA level in one --/Y11Y11/CATCAT plant; D, RNA levels in one wild-type Col-0; E, RNA level in one CAT2HP1 plant; F, RNA level in one CAT2HP2 plant.

