FIGURE 3.
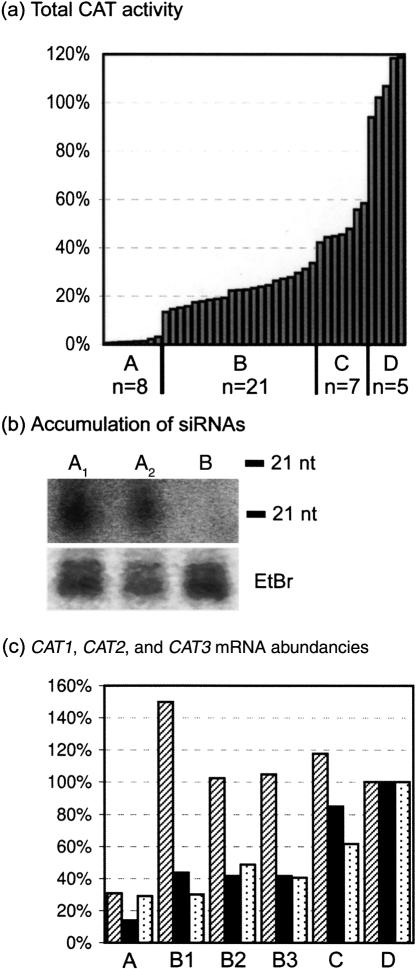
Protein levels, siRNA accumulation, and RNA levels in F2 progeny plants and parental plants. (a) Total CAT activity in F2 progeny plants with segregating X21 and Y11 loci and parental --/ Y11Y11/CATCAT plants. The total CAT activity of the different transgenic plants is relative to the average CAT activity of five wild-type plants (100%; not shown). A, X21-/Y11Y11/CATCAT and X21X21/Y11Y11/CATCAT; B, X21-/Y11-/CATCAT; C, X21X21/Y11-/CATCAT; D, --/ Y11Y11/CATCAT; n, total number of plants per group. (b) Accumulation of CAT2-specific siRNAs in two silenced X21X21/Y11Y11/CATCAT plants (A1 and A2) and absence of siRNAs in one nonsilenced --/Y11Y11/CATCAT plant (B). Low molecular weight RNA was extracted from leaves of 4-wk-old plants. RNA oligomers of 21 nt and 24 nt were used as molecular markers. siRNAs were detected with a hydrolyzed 32P-labeled probe comprising 274 bp in the 3′ end of the CAT2 sequence. With this probe it is impossible to discriminate between siRNAs originating from the transgene Y11 or from the endogenous sequences. The predominant ethidium bromide (EtBr)-stained species in the low molecular weight RNA fraction are shown as loading controls. (c) CAT1, CAT2, and CAT3 mRNA abundancies. Quantitative real-time PCRs were performed with gene-specific primers to determine the RNA levels of CAT1 (shaded bars), CAT2 (black bars), and CAT3 (dotted bars) relative to those in a wild-type background (100%). A, RNA levels in one X21X21/Y11Y11/CATCAT plant; B1, B2, and B3, RNA levels in three X21-/Y11-/CATCAT plants; C, RNA levels in one X21X21/Y11-/CATCAT plant; D, RNA levels in wild-type Col-0.

