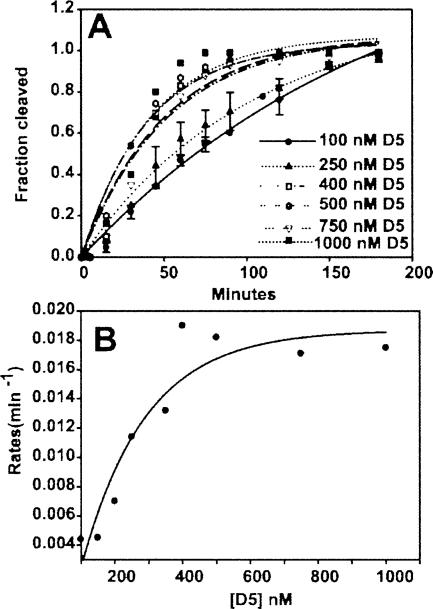
FIGURE 4.
Single turnover kinetics of SER reaction catalyzed by D5. (A) Monoexponential fit of the time course for the formation of cleaved product in the presence of excess D123 (2 μM) and increasing concentration of D5 (0.1–1.0 μM). The fluorescent intensity in bands S and P (see Fig. 5A) was used to calculate the fraction of cleaved product. (B) Michaelis-Menten binding curve for data in A. K m is the [D5] at half-maximum rate and K cat is the maximal rate at D5 saturation. Please see Materials and Methods for details of extracting the kinetic constants from the experimental data.

