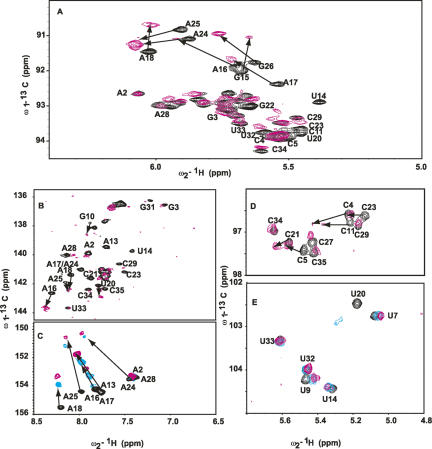
FIGURE 7.
NMR spectra, at 45°C, showing the chemical shift perturbations of D5 nucleotides on binding D123 for resonances of the (A) ribose H1′–C1′, (B) H6–C6 and H8–C8, (C) base H2–C2, (D) cytosine base H5–C5, and (E) uracil base H5–C5. Arrows depict residues with most chemical shift perturbation with increasing D123 concentration (0 and ∼0.22 mM), indicative of likely binding sites. Note how A2 and G3 resonances are barely perturbed. For C and D, we depict three titration points to indicate the direction of the perturbations ([D123] mM: 0, black; 0.1, cyan; 0.22, magenta).

